Streamlit教程#
The fastest way to build and share data apps#
Streamlit 是一个开源 Python 库,可让您轻松创建和共享用于机器学习和数据科学的精美自定义 Web 应用程序。
Streamlit 的使用场景如:
- 研究开发了一个临床预测模型,使用 Streamlit 将该预测模型搭建在网站上随论文发表或供别人体检。
- 公司某部门人员需要批量处理 Excel 文件,因而可以写一个 python 脚本自动化处理;但部门人员并不会用 python、也未安装 python 环境,此时便可将该脚本使用 Streamlit 部署成 Web App,部门人员使用时只需点击上传 Excel 文件,然后点击下载处理完成的文件即可。
安装
sudo pip3 install streamlit
使用
streamlit run stock.py
来自命令行的快速帮助 $ streamlit --help
依赖
1
| Successfully installed Send2Trash-1.7.1 altair-4.1.0 argon2-cffi-20.1.0 base58-2.1.0 blinker-1.4 cachetools-4.2.2 cffi-1.14.6 gitdb-4.0.7 gitpython-3.1.20 ipykernel-5.5.5 ipywidgets-7.6.3 jupyterlab-widgets-1.0.0 notebook-6.4.0 pillow-8.3.1 prometheus-client-0.11.0 ptyprocess-0.7.0 pyarrow-5.0.0 pycparser-2.20 pydeck-0.6.2 smmap-4.0.0 streamlit-0.85.1 terminado-0.10.1 toml-0.10.2 toolz-0.11.1 tornado-6.1 typing-extensions-3.10.0.0 tzlocal-2.1 validators-0.18.2 watchdog-2.1.3 widgetsnbextension-3.5.1
|
执行streamlit hello
1
2
3
4
5
6
7
8
9
| Welcome to Streamlit. Check out our demo in your browser.
Local URL: http://localhost:8501
Network URL: http://192.168.0.104:8501
Ready to create your own Python apps super quickly?
Head over to https://docs.streamlit.io
May you create awesome apps!
|
报错:AttributeError: module ‘google.protobuf.descriptor’ has no attribute ‘_internal_create_key’
升级pip3
sudo pip3 install --upgrade protobuf
示例:制作网页展示股票历史交易趋势#
安装yfinance
sudo pip3 install yfinance
demo
 1
 2
 3
 4
 5
 6
 7
 8
 9
10
11
12
13
14
15
16
17
18
19
20
21
| import streamlit as st
import yfinance as yf
st.write("""
# Simple Stock Price App
Shown are the stock closing prices and volume of Apple!
""")
# define the ticker symbol
tickerSymbol = 'AAPL'
# 'MSFT' 'GOOGL' 'AAPL'
#get data on this ticker
tickerData = yf.Ticker(tickerSymbol)
# get the historical prices for this ticker
tickerDf=tickerData.history(start='2011-6-22', end='2021-6-22')
print(tickerDf)
tickerDf.columns
# Index(['Open', 'High', 'Low', 'Close', 'Volume', 'Dividends', 'Stock Splits'],dtype='object')
# get the historical prices for this ticker from this corperation is started
tickerData.history(period='max')
|
生成web app
stock.py
 1
 2
 3
 4
 5
 6
 7
 8
 9
10
11
12
13
14
15
16
17
18
19
20
21
22
23
24
25
| import streamlit as st
import yfinance as yf
ticker_dict={'Google':'GOOGL', 'Microsoft':'MSFT', 'Apple':'AAPL'}
#add a selectbox to the sidebar
add_selectbox= st.sidebar.selectbox('Which company would you like to be displayed?', (list(ticker_dict.keys())))
st.write(f"""
# Simple Stock Price App
Shown are the stock closing prices and volumes of {add_selectbox}!
""")
# define the ticker symbol
tickerSymbol = ticker_dict[add_selectbox]
# 'MSFT' 'GOOGL' 'AAPL'
#get data on this ticker
tickerData = yf.Ticker(tickerSymbol)
# get the historical prices for this ticker
tickerDf=tickerData.history(start='2011-6-22', end='2021-6-22')
st.line_chart(tickerDf.Close)
st.line_chart(tickerDf.Volume)
|
streamlit run stock.py
探索公共的Uber数据集#
在本教程中,您将使用Streamlit的核心功能来创建一个交互式应用程序; 探索公共的Uber数据集,以了解纽约市的接送服务。 完成后,您将知道如何获取和缓存数据,绘制图表,在地图上绘制信息以及使用交互式小部件(例如滑块)来过滤结果。
创建一个app#
第一步,创建一个 uber_pickups.py.
打开uber_pickups.py 并添加以下代码:
1
2
3
| import streamlit as st
import pandas as pd
import numpy as np
|
每个好的app都有一个标题,我们也加一个:
1
| st.title('Uber pickups in NYC')
|
在终端执行以下指令来启动app:
1
| $ streamlit run uber_pickups.py
|
不出意外的话,app将自动打开你的浏览器的一个新tab页。
获取数据#
Now that you have an app, the next thing you’ll need to do is fetch the Uber dataset for pickups and drop-offs in New York City.
现在我们有了一个app,接接下来我们需要做的就是获取 Uber 的数据集,以便在纽约市进行客运。
让我们写一个函数来读入数据吧,添加以下代码到你的脚本中:
 1
 2
 3
 4
 5
 6
 7
 8
 9
10
| DATE_COLUMN = 'date/time'
DATA_URL = ('https://s3-us-west-2.amazonaws.com/'
'streamlit-demo-data/uber-raw-data-sep14.csv.gz')
def load_data(nrows):
data = pd.read_csv(DATA_URL, nrows=nrows)
lowercase = lambda x: str(x).lower()
data.rename(lowercase, axis='columns', inplace=True)
data[DATE_COLUMN] = pd.to_datetime(data[DATE_COLUMN])
return data
|
load_data 是一个函数,用来下载数据,并将它放入到Pandas dataframe中,然后将数据的data列从文本转成datetime类。该函数接受一个参数(nrows),该参数指定了您想要加载到dataframe中的行数。
现在来测试下函数并检查输出吧,在你的函数下,添加以下代码:
1
2
3
4
5
6
| # Create a text element and let the reader know the data is loading.
data_load_state = st.text('Loading data...')
# Load 10,000 rows of data into the dataframe.
data = load_data(10000)
# Notify the reader that the data was successfully loaded.
data_load_state.text('Loading data...done!')
|
app的右上角的按钮会询问你是否重跑app。选择Always rerun,您每次保存时都会自动看到所做的更改。
事实证明,下载数据和将10,000行加载到数据框中需要花费很长时间。 将日期列转换为日期时间也不是一件容易的事。 您不希望每次更新应用程序时都重新加载数据–幸运的是,Streamlit允许您缓存数据。
轻松缓存#
在 load_data 前添加@st.cache装饰器:
1
2
| @st.cache
def load_data(nrows):
|
然后保存,streamlit将自动重跑app. 由于这是您第一次使用@st.cache跑脚本, 你不会看到任何变换. 让我们稍微调整一下文件,以便您了解缓存的功能。
将 代码data_load_state.text('Loading data...done!') 改成:
1
| data_load_state.text("Done! (using st.cache)")
|
现在保存。看到你加进去的那一行了吗?如果你退一步看,这真的很神奇。一些神奇的事情正在幕后发生,只需要一行代码就可以激活它。
这是如何工作的?#
让我们花点时间来看看 @st.cache 的实际工作.
当你使用Streamlit的cache注解来标记一个函数时,就告诉Streamlit 任何时候调用这个函数都需要检查三个东西:
- 组成函数提的实际字节码
- 这个函数依赖的代码、变量和文件
- 调用函数时传入的参数
如果Streamlit是第一次见到这些内容,它就会运行函数并在本地缓存中 保存结果。下一次函数再被调用时,如果以上三者没有变化,那么Streamlit就 可以直接利用缓存的值。
这种方式看起来很棒,但是也有一些局限:
- Streamlit将仅检查当前工作目录中的更改。 这意味着Streamlit仅检测已安装的Python库中的代码更新。
- 如果您的函数是不确定的(即,它的输出取决于随机数),或者如果它从外部时变源(例如,实时股票行情报价器服务)提取数据,那么缓存的值将是不明智的。
- 最后,由于缓存的值是按引用存储的(出于性能原因并能够支持TensorFlow之类的库),因此您不应更改缓存的函数的输出。 请注意,在这里,Streamlit足够聪明,可以检测到这些突变并显示响亮的警告,说明如何解决此问题。
尽管要牢记这些限制很重要,但在很多时候它们往往不会成为问题。 那些时候,此缓存确实具有变革性。
提示:
每当你的代码里存在一个耗时计算,请考虑使用@st.cache重构,如果可能的话。
现在您已经知道Streamlit的缓存工作原理,让我们回到Uber的客运数据。
检查原始数据#
在开始使用原始数据之前,最好先查看一下要使用的原始数据。 让我们向应用添加子标题和原始数据的打印输出:
1
2
| st.subheader('Raw data')
st.write(data)
|
在 快速上手教程 我们了解到 st.write 将会呈现您传递给它的几乎所有内容。 在这种情况下,您要传入一个数据框并将其呈现为交互式表格。
st.write 尝试根据输入的数据类型做正确的事情。 如果它没有按照您的期望做,则可以使用专门的命令,例如 st.dataframe替代. 完整列表参见API reference.
或者,您可以使用专门的语句,例如 st.dataframe(),向您的应用添加特定的数据集。
绘制直方图#
现在,您已经有机会查看数据集并观察可用数据,让我们更进一步,并绘制直方图,查看Uber在纽约市最忙的时间。
首先,让我们在原始数据部分下面添加一个子标题:
1
| st.subheader('Number of pickups by hour')
|
使用NumPy生成一个直方图,客运时间按小时划分:
1
2
| hist_values = np.histogram(
data[DATE_COLUMN].dt.hour, bins=24, range=(0,24))[0]
|
现在使用 st.bar_chart() 方法来绘制这个直方图。
1
| st.bar_chart(hist_values)
|
保存脚本。 此直方图应立即显示在您的应用中。 快速浏览后,看来最忙的时间是17:00(下午5点)。
我们使用了 Streamlit 的原生 bar_chart() 方法来绘制图, 但我们需要知道streamlit是支持一些流行的图表库,如 Altair, Bokeh, Plotly, Matplotlib等. 完整列表参见 supported charting libraries.
在地图上绘制数据#
在Uber的数据集中使用直方图可以帮助我们确定客运最忙的时间,但是如果我们想弄清楚客运在整个城市集中在哪里,那该怎么办。 尽管您可以使用条形图来显示此数据,但是除非您非常熟悉城市中的纬度和经度坐标,否则就不容易理解。 为了显示客运的集中度,让我们使用Streamlit 的st.map() 方法将数据覆盖在纽约市的地图上。
为该部分添加一个子标题:
1
| st.subheader('Map of all pickups')
|
使用 st.map() 函数来绘制地图:
保存脚本。 该地图是完全交互式的。 尝试平移或放大一点。
在绘制了柱状图之后,你确定了Uber打车最繁忙的时间是17:00。让我们重新画一幅地图,以显示在17:00时皮卡车的集中情况。
找到以下代码片段:
1
2
| st.subheader('Map of all pickups')
st.map(data)
|
替换为:
1
2
3
4
| hour_to_filter = 17
filtered_data = data[data[DATE_COLUMN].dt.hour == hour_to_filter]
st.subheader(f'Map of all pickups at {hour_to_filter}:00')
st.map(filtered_data)
|
您应该可以立即看到数据更新。
要绘制此地图,我们使用了Streamlit中内置的简单地图功能,但是如果您想可视化复杂的地图数据,建议您看一下st.deckgl_chart.
使用滑块过滤结果#
在上一部分中,当您绘制地图时,用于过滤结果的时间被硬编码到脚本中,但是如果我们想让读者实时地动态过滤数据该怎么办? 您可以使用Streamlit的小部件。 使用 st.slider() 方法来添加一个滑块.
定位 hour_to_filter 并用以下代码替换:
1
| hour_to_filter = st.slider('hour', 0, 23, 17) # min: 0h, max: 23h, default: 17h
|
使用滑块并实时观看地图更新。
使用复选框切换数据#
滑块只是动态更改应用程序组成的一种方法。 让我们使用st.checkbox函数来为app添加一个复选框. 我们将使用这个复选框来显示/隐藏应用程序顶部的原始数据表。
定位以下代码:
1
2
| st.subheader('Raw data')
st.write(data)
|
使用以下代码替换:
1
2
3
| if st.checkbox('Show raw data'):
st.subheader('Raw data')
st.write(data)
|
我们确定您有自己的想法。 完成本教程的操作后,通过API reference可以查看Streamlit在我们的网站中公开的所有小部件 。
让我们放在一起#
就这样,你坚持到了最后。这是我们的交互式应用程序的完整脚本。
提示:
如果您已经跳过了前面的步骤,那么在创建脚本之后,运行Streamlit的命令是Streamlit run [app name].
uber_pickups.py
1
2
3
4
5
6
7
8
9
10
11
12
13
14
15
16
17
18
19
20
21
22
23
24
25
26
27
28
29
30
31
32
33
34
35
36
| import streamlit as st
import pandas as pd
import numpy as np
st.title('Uber pickups in NYC')
DATE_COLUMN = 'date/time'
DATA_URL = ('https://s3-us-west-2.amazonaws.com/'
'streamlit-demo-data/uber-raw-data-sep14.csv.gz')
@st.cache
def load_data(nrows):
data = pd.read_csv(DATA_URL, nrows=nrows)
lowercase = lambda x: str(x).lower()
data.rename(lowercase, axis='columns', inplace=True)
data[DATE_COLUMN] = pd.to_datetime(data[DATE_COLUMN])
return data
data_load_state = st.text('Loading data...')
data = load_data(10000)
data_load_state.text("Done! (using st.cache)")
if st.checkbox('Show raw data'):
st.subheader('Raw data')
st.write(data)
st.subheader('Number of pickups by hour')
hist_values = np.histogram(data[DATE_COLUMN].dt.hour, bins=24, range=(0,24))[0]
st.bar_chart(hist_values)
# Some number in the range 0-23
hour_to_filter = st.slider('hour', 0, 23, 17)
filtered_data = data[data[DATE_COLUMN].dt.hour == hour_to_filter]
st.subheader('Map of all pickups at %s:00' % hour_to_filter)
st.map(filtered_data)
|
特殊用法示例#
创建自己的 App#
Streamlit 写 App 就是创建一个 py 文件,而不需要分别创建前端和后端。一个示例 py 文件(example.py)如下:
1
2
3
4
5
6
7
8
9
10
11
12
13
14
15
16
17
18
19
20
21
22
23
24
25
| import streamlit as st
import numpy as np
import pandas as pd
import matplotlib.pyplot as plt
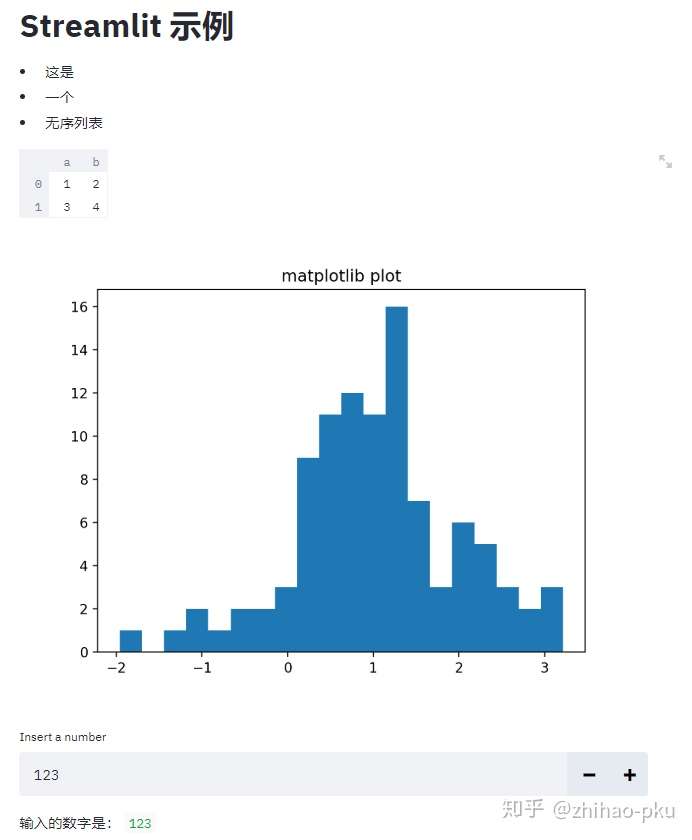
# 展示文本;文本直接使用Markdown语法
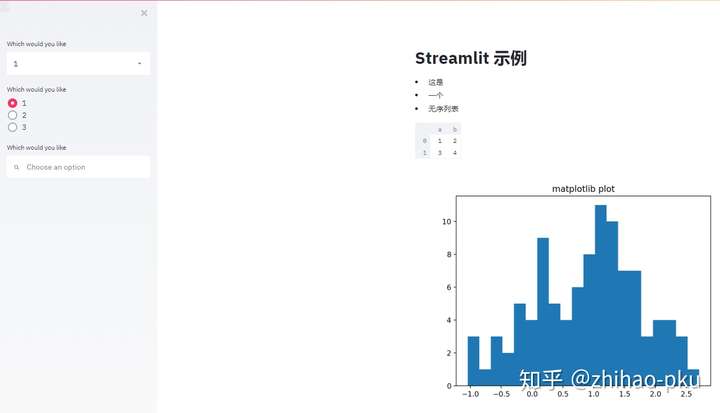
st.markdown("# Streamlit示例")
st.markdown("""
- 这是
- 一个
- 无序列表
""")
# 展示pandas数据框
st.dataframe(pd.DataFrame([[1, 2], [3, 4]], columns=["a", "b"]))
# 展示matplotlib绘图
arr = np.random.normal(1, 1, size=100)
plt.hist(arr, bins=20)
plt.title("matplotlib plot")
st.pyplot()
# 加入交互控件,如输入框
number = st.number_input("Insert a number", 123)
st.write("输入的数字是:", number)
|
将该 py 文件放在某文件夹下,cmd 中 cd 到该文件夹,输入命令 streamlit run example.py,点击出现的 URL 后可见界面:
- 可以使用
streamlit run example.py --server.port 80 指定 App 在 80 端口运行 - 上述方式将 App 搭建在本地机上,如果想将 App 供别人访问,则需将 App 搭建在服务器如**阿里云服务器**或者部署在托管网站如 heroku 再或者使用内网穿透软件如 花生壳。网上不少教程,可自行查阅~
Streamlit 主要用法总结#
1
2
3
4
5
6
7
8
9
10
| import streamlit as st
import pandas as pd
import numpy as np
import time
import matplotlib.pyplot as plt
import seaborn as sns
import plotly.figure_factory as ff
import altair as alt
from PIL import Image
import base64
|
文字、公式#
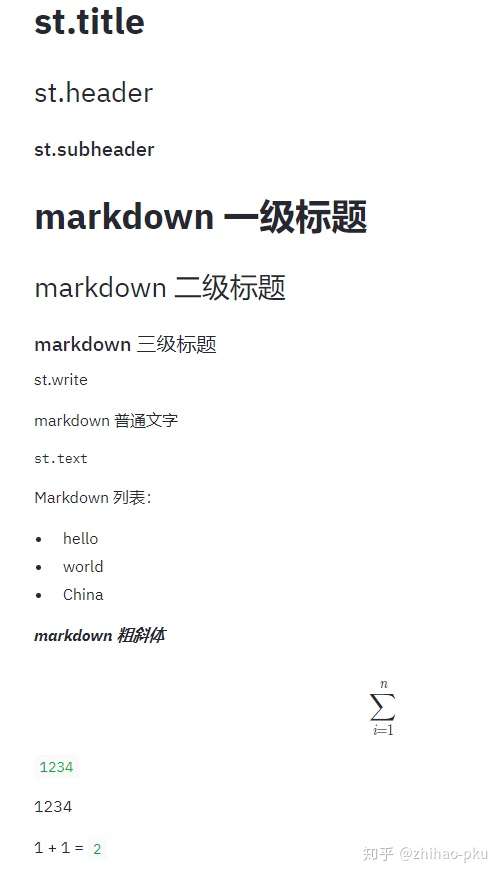
对照输出查看显示效果
1
2
3
4
5
6
7
8
9
10
11
12
13
14
15
16
17
18
19
20
21
22
23
24
25
26
27
28
29
30
31
32
33
34
| st.title("st.title")
st.header("st.header")
st.subheader("st.subheader")
st.markdown("# markdown一级标题")
st.markdown("## markdown二级标题")
st.markdown("### markdown三级标题")
# ------------------------------------
st.write("st.write")
st.markdown("markdown普通文字")
st.text("st.text")
# ------------------------------------
st.markdown("""
Markdown列表:
- hello
- world
- China
""")
st.markdown("***markdown粗斜体***")
# ------------------------------------
st.latex("\sum_{i=1}^{n}")
# ------------------------------------
st.write(1234)
st.write("1234")
st.write("1 + 1 = ", 2)
|
st.write()#
st.write () 是一个泛型函数,根据传入对象不同采取不同的展示方式,比如传入 pandas.DataFrame 时,st.write (df) 默认调用 st.dataframe (),传入 markdown 时,st.write (markdown) 默认调用 st.markdown ();跟 R 的泛型函数非常类似。可传入的对象有:
- write(data_frame) : Displays the DataFrame as a table.
- write(func) : Displays information about a function.
- write(module) : Displays information about the module.
- write(dict) : Displays dict in an interactive widget.
- write(obj) : The default is to print str(obj).
- write(mpl_fig) : Displays a Matplotlib figure.
- write(altair) : Displays an Altair chart.
- write(keras) : Displays a Keras model.
- write(graphviz) : Displays a Graphviz graph.
- write(plotly_fig) : Displays a Plotly figure.
- write(bokeh_fig) : Displays a Bokeh figure.
- write(sympy_expr) : Prints SymPy expression using LaTeX.
- write(markdown):
比如:
1
2
3
4
5
6
7
8
9
10
11
12
13
14
15
16
17
18
19
20
21
22
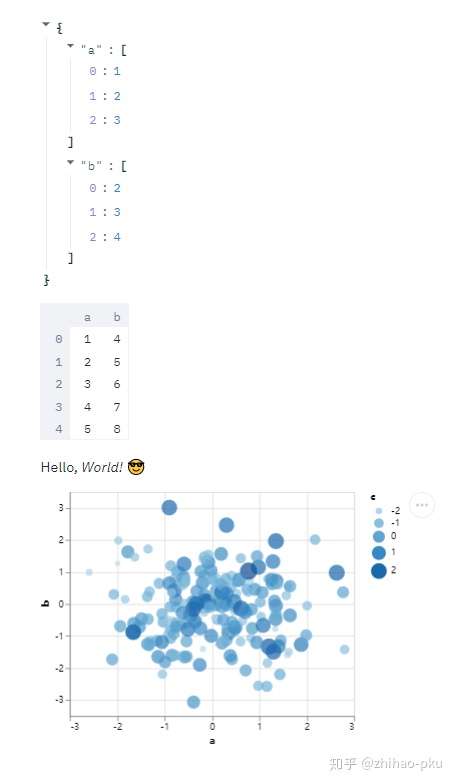
| # 字典
st.write({"a": [1, 2, 3],
"b": [2, 3, 4]})
# pandas数据框
st.write(pd.DataFrame({
"a": [1, 2, 3, 4, 5],
"b": [4, 5, 6, 7, 8]
}))
# Markdown文字
st.write("Hello, *World!* :sunglasses:")
# 绘图对象
df = pd.DataFrame(
np.random.randn(200, 3),
columns=["a", "b", "c"]
)
c = alt.Chart(df).mark_circle().encode(
x="a", y="b", size="c", color="c", tooltip=["a", "b", "c"])
st.write(c)
|
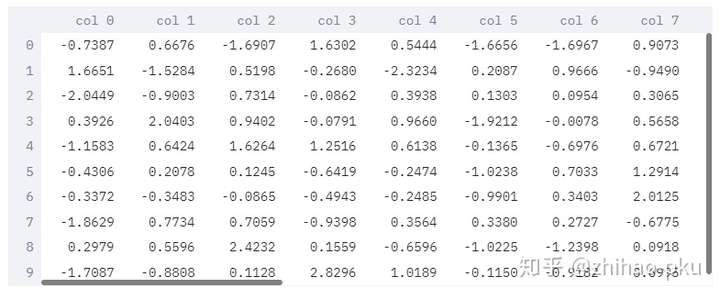
两种表格,动态表格和静态表格
1
2
3
4
5
6
7
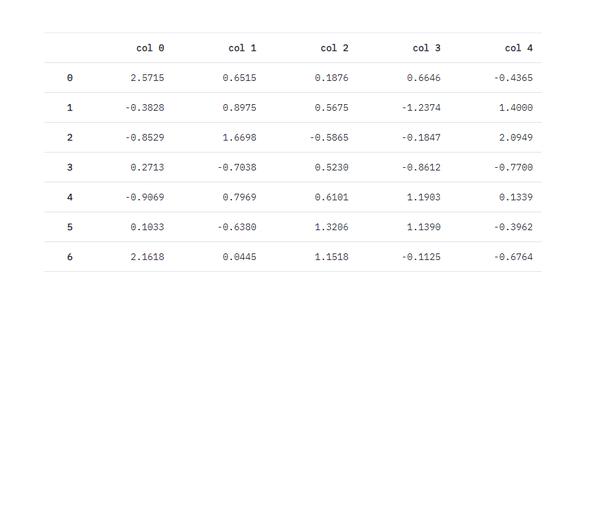
| # 动态表格(表格太大时只展示一部分,可滑动表格下方滑动条查看不同部分)
# st.write默认调用st.dataframe()
df = pd.DataFrame(
np.random.randn(10, 20),
columns=('col %d' % i for i in range(20)))
st.write(df)
|
1
2
3
4
5
6
7
| # 静态表格(展示表格全部内容,太大时滑动App界面下方的滑动条查看不同部分)
df = pd.DataFrame({
"a": [1, 2, 3, 4, 5],
"b": [4, 5, 6, 7, 8]
})
st.table(df)
|

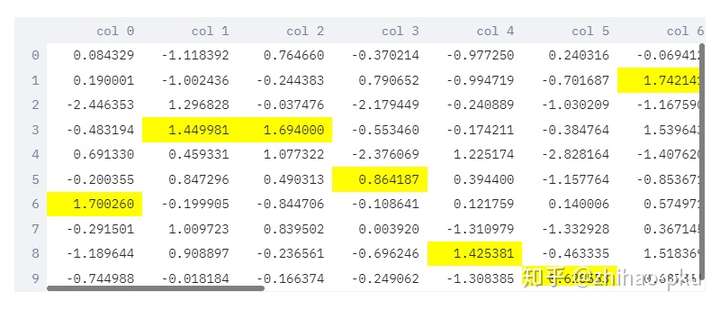
pandas.DataFrame 的 style 也可正常显示
1
2
3
4
5
6
7
| df = pd.DataFrame(
np.random.randn(10, 20),
columns=('col %d' % i for i in range(20)))
st.dataframe(df.style.highlight_max(axis=0))
<streamlit.DeltaGenerator.DeltaGenerator at 0x28b60f62048>
|
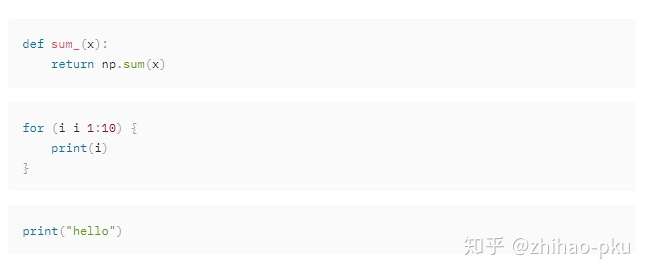
Code#
仅展示 Code,Code 不执行
1
2
3
4
5
6
7
8
9
10
11
12
13
14
15
16
17
| code = """
def sum_(x):
return np.sum(x)
"""
st.code(code, language="python")
code = """
for (i i 1:10) {
print(i)
}
"""
st.code(code, language="r")
st.markdown("""
```python
print("hello")
""")
|
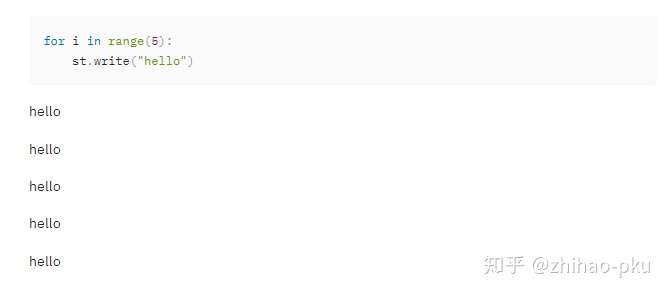
展示 Code,同时执行 Code;需要将 code 放入 st.echo() 内
1
2
3
| with st.echo():
for i in range(5):
st.write("hello")
|
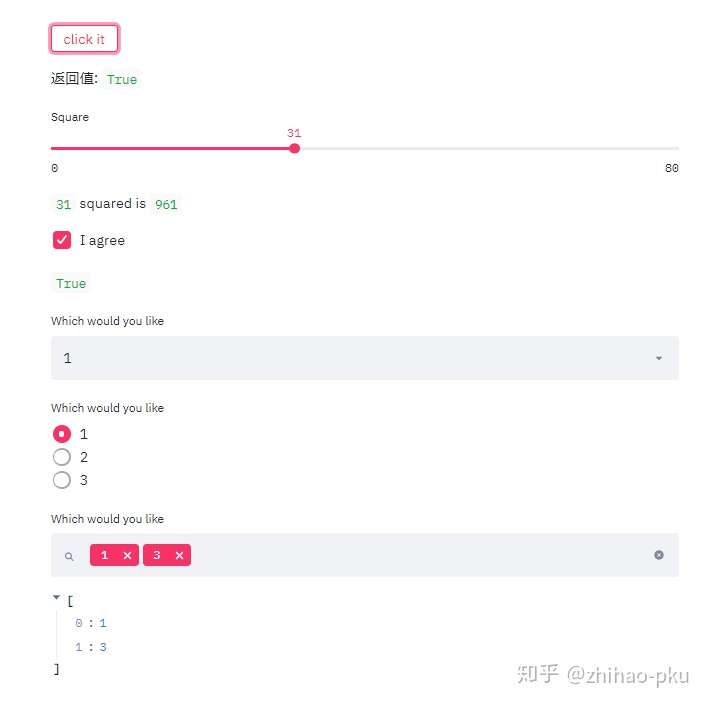
各种控件#
 1
 2
 3
 4
 5
 6
 7
 8
 9
10
11
12
13
14
15
16
17
18
19
20
21
22
23
24
25
26
27
28
29
30
31
32
33
34
35
36
37
| # 数字输入框
number = st.number_input("Insert a number", 123)
# 单行文本输入框
word = st.text_input("Insert a word", "123")
st.write("The number is", number, "The word is", word)
# 多行文本输入框
st.text_area("Text to analyze", "I love China")
# 日期输入框
st.date_input("Insert a date")
# 时间输入框
st.time_input("Insert a time")
# 点击按钮
number = st.button("click it")
st.write("返回值:", number)
# 滑动条
x = st.slider("Square", min_value=0, max_value=80)
st.write(x, "squared is", np.power(x, 2))
# 检查框
res = st.checkbox("I agree")
st.write(res)
# 单选框
st.selectbox("Which would you like", [1, 2, 3])
# 单选按钮
st.radio("Which would you like", [1, 2, 3])
# 多选框
selector = st.multiselect("Which would you like", [1, 2, 3])
st.write(selector)
|


上传 csv 文件
1
2
3
4
5
| uploaded_file = st.file_uploader("Choose a CSV file", type="csv")
if uploaded_file is not None:
data = pd.read_csv(uploaded_file)
st.write(data)
|

下载:目前 Streamlit 还没有专门的下载控件,下载 pandas Dataframe 为 csv 文件可通过以下方式实现
点击 Download CSV File 便可下载文件
1
2
3
4
5
6
7
| data = [(1, 2, 3)]
df = pd.DataFrame(data, columns=["Col1", "Col2", "Col3"])
csv = df.to_csv(index=False)
b64 = base64.b64encode(csv.encode()).decode()
href = f'<a href="data:file/csv;base64,{b64}">Download CSV File</a> (right-click and save as <some_name>.csv)'
st.markdown(href, unsafe_allow_html=True)
|

侧边栏控件#
以上控件大部分都有对应的侧边栏形式,如上述 st.selectbox 若想放置在侧边栏,可使用 st.sidebar.selectbox
1
2
3
4
5
6
7
8
9
| # 单选框
st.sidebar.selectbox("Which would you like", [1, 2, 3], key="1")
# 单选按钮
st.sidebar.radio("Which would you like", [1, 2, 3], key="1")
# 多选框
selector = st.sidebar.multiselect("Which would you like", [1, 2, 3], key="3")
st.write(selector)
|
绘图、图片、音频、视频#
支持的绘图库:
- streamlit 自带绘图:
st.line_chart()、bar_chart() 等 - matplotlib 或 seaborn:
st.pyplot() - altair:
st.altair_chart() - vega:
st.vega_lite_chart() - plotly:
st.plotly_chart() - bokeh:
st.bokeh_chart()
streamlit 自带绘图#
1
2
3
4
5
6
7
8
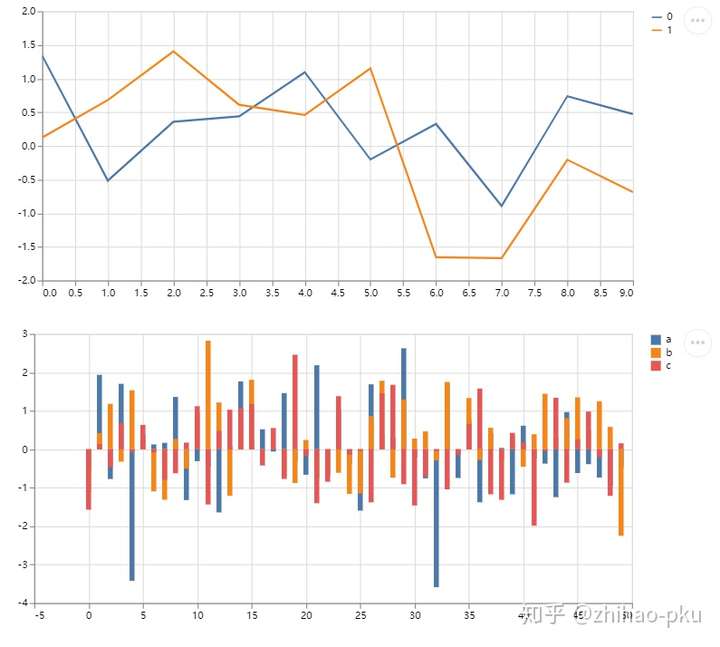
| st.line_chart()` 和 `st.bar_chart()
st.line_chart(np.random.randn(10, 2))
chart_data = pd.DataFrame(
np.random.randn(50, 3),
columns=["a", "b", "c"]
)
st.bar_chart(chart_data)
|
matplotlib 或 seaborn 绘图#
1
2
3
4
5
6
7
8
9
10
11
12
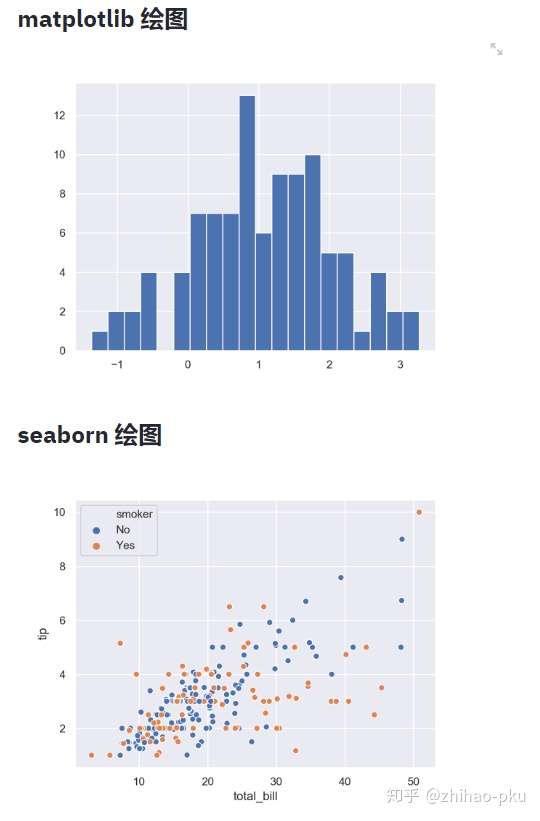
| st.markdown("# matplotlib绘图")
arr = np.random.normal(1, 1, size=100)
plt.hist(arr, bins=20)
st.pyplot()
st.markdown("# seaborn绘图")
tips = sns.load_dataset("tips")
sns.set(style="darkgrid")
sns.scatterplot(x="total_bill", y="tip", hue="smoker", data=tips)
st.pyplot()
|
plotly 绘图#
1
2
3
4
5
6
7
8
9
10
11
12
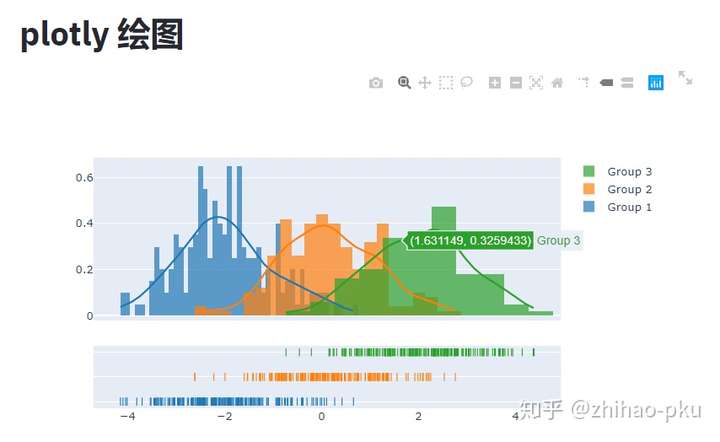
| x1 = np.random.randn(200) - 2
x2 = np.random.randn(200)
x3 = np.random.randn(200) + 2
hist_data = [x1, x2, x3]
group_labels = ["Group 1", "Group 2", "Group 3"]
fig = ff.create_distplot(
hist_data, group_labels,
bin_size=[0.1, 0.25, 0.5])
st.markdown("# plotly绘图")
st.plotly_chart(fig)
|
1
2
3
4
5
6
| # 绘制1000个点的坐标
map_data = pd.DataFrame(
np.random.randn(1000, 2) / [50, 50] + [37.76, -122.4],
columns=['lat', 'lon'])
st.map(map_data)
|

展示图片、音频、视频#
- 图片:st.image ()
- 音频:st.audio ()
- 视频:st.video ()
1
2
3
4
| st.error("错误显示为")
st.warning("警告显示为")
st.info("普通消息显示为")
st.success("成功消息显示为")
|

展示进度#
占位符#
占位符可在后续向其中添加内容
1
2
3
4
5
6
7
8
9
10
11
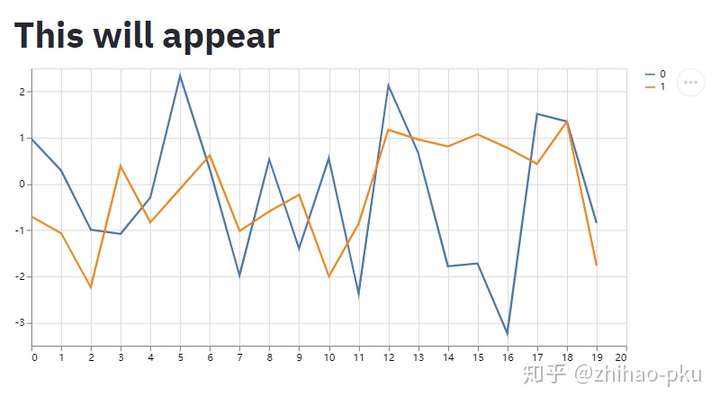
| # 添加两个占位符
slot1 = st.empty()
slot2 = st.empty()
# 占位符中插入文字
time.sleep(0.5)
slot1.markdown("# This will appear")
# 占位符中画图
time.sleep(0.5)
slot2.line_chart(np.random.randn(20, 2))
|
进度条#
1
2
3
4
5
6
7
8
9
10
11
12
13
14
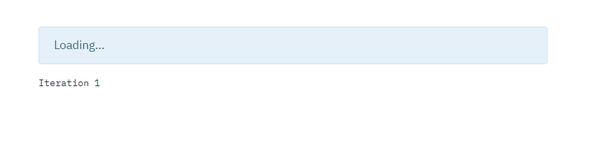
| # 添加占位符
placeholder = st.empty()
# 创建进度条
bar = st.progress(0)
for i in range(100):
time.sleep(0.05)
# 不断更新占位符的内容
placeholder.text(f"Iteration {i+1}")
# 不断更新进度条
bar.progress(i + 1)
# 状态
st.success("Finished")
|
等待条#
1
2
3
4
5
6
| with st.spinner("Wait for it..."):
for i in range(100):
print("hello")
time.sleep(0.05)
st.success("Done!")
|

动态扩增表格或动态绘图#
表格、图片可以使用 add_rows() 方法添加新数据
动态扩增表格#
1
2
3
4
5
6
7
8
9
10
11
12
13
| df1 = pd.DataFrame(
np.random.randn(5, 5),
columns=("col %d" % i for i in range(5))
)
tb_table = st.table(df1)
for i in range(10):
df2 = pd.DataFrame(
np.random.randn(1, 5),
columns=("col %d" % i for i in range(5))
)
tb_table.add_rows(df2)
time.sleep(0.5)
|
动态折线图#
1
2
3
4
5
6
7
8
9
10
11
12
| pb = st.progress(0)
status_txt = st.empty()
chart = st.line_chart(np.random.randn(10, 2))
for i in range(100):
pb.progress(i)
new_rows = np.random.randn(10, 2)
status_txt.text(
"The latest number is: %s" % new_rows[-1, 1]
)
chart.add_rows(new_rows)
time.sleep(0.05)
|

对于费时间的步骤,可打包成函数,并使用缓存;第一次调用函数时,正常运行过程;第二次调用函数时,则不再重新计算,而是直接使用上一步调用函数时返回的结果。
1
2
3
4
5
6
7
| @st.cache() # 使用缓存
def compute_long_time():
SUM = 0
for i in range(100):
SUM += i
time.sleep(0.05)
return SUM
|
第一次调用函数,费时较长
1
| st.write(compute_long_time())
|
再次调用该函数,瞬间出结果
1
| st.write(compute_long_time())
|
Magic commands#
Streamlit 提供了魔法方法,对于某些内容,直接书写便会自动调用 st.write ()
 1
 2
 3
 4
 5
 6
 7
 8
 9
10
11
12
13
14
15
16
17
18
19
20
21
22
23
24
25
26
27
| "***hello world***"
"""
# This is the document title
This is some _markdown_.
"""
# ---------------------------------
st.write("***hello world***")
st.write("""
# This is the document title
This is some _markdown_.
""")
# ---------------------------------
st.markdown("***hello world***")
st.markdown("""
# This is the document title
This is some _markdown_.
""")
|
可以看到,以上三种书写展示结果相同,原因为第一种方式会自动调用 st.write()(魔法方法),而 st.write() 为一个泛型函数,内部传入 Markdown 时会自动调用 st.markdown(),因此三种方式归根结底都是使用了 st.markdown()

展示 df 和 x,两者效果相同
 1
 2
 3
 4
 5
 6
 7
 8
 9
10
11
12
13
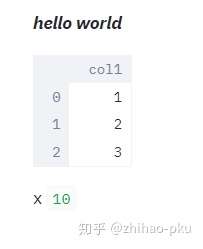
| df = pd.DataFrame({"col1": [1, 2, 3]})
df
x = 10
"x", x
# ---------------------------------
df = pd.DataFrame({"col1": [1, 2, 3]})
st.write(df) # 默认调用st.dataframe()
x = 10
st.write("x", x)
|
连接数据库#
将 Streamlit 连接到 MySQL#
本指南介绍了如何从 Streamlit 共享或 Streamlit for Teams 安全地访问 MySQL 数据库。它使用mysql-connector-python库和 Streamlit 的秘密管理。
创建 MySQL 数据库#
笔记
如果您已经有要使用的数据库,请随时跳到下一步。
首先,按照本教程安装 MySQL 并启动 MySQL 服务器(记下用户名和密码!)。一旦您的 MySQL 服务器启动并运行,请使用mysql客户端连接到它并输入以下命令以创建一个数据库和一个包含一些示例值的表:
1
2
3
4
5
6
7
8
9
10
| CREATE DATABASE pets;
USE pets;
CREATE TABLE mytable (
name varchar(80),
pet varchar(80)
);
INSERT INTO mytable VALUES ('Mary', 'dog'), ('John', 'cat'), ('Robert', 'bird');
|
将用户名和密码添加到您的本地应用程序机密#
您的本地 Streamlit 应用程序将从.streamlit/secrets.toml您应用程序根目录中的文件中读取机密。如果此文件尚不存在,请创建此文件并添加您的 MySQL 服务器的数据库名称、用户和密码,如下所示:
1
2
3
4
5
6
7
8
| # .streamlit/secrets.toml
[mysql]
host = "localhost"
port = 3306
database = "xxx"
user = "xxx"
password = "xxx"
|
重要的
将此文件添加.gitignore到您的 Github 存储库中,但不要将其提交!
将您的应用机密复制到云端#
由于上述secrets.toml文件未提交到 Github,您需要将其内容单独传递给您部署的应用程序(在 Streamlit 共享或 Streamlit for Teams 上)。转到应用程序仪表板,然后在应用程序的下拉菜单中,单击Edit Secrets。将 的内容复制secrets.toml到文本区域。可在Secrets Management获得更多信息。

将 mysql-connector-python 添加到您的需求文件中#
将mysql-connector-python包添加到您的requirements.txt文件中,最好固定其版本(替换x.x.x为您要安装的版本):
1
2
| # requirements.txt
mysql-connector-python==x.x.x
|
编写您的 Streamlit 应用程序#
将下面的代码复制到您的 Streamlit 应用程序并运行它。确保适应query使用您的表的名称。
 1
 2
 3
 4
 5
 6
 7
 8
 9
10
11
12
13
14
15
16
17
18
19
20
21
22
23
24
25
26
| # streamlit_app.py
import streamlit as st
import mysql.connector
# Initialize connection.
# Uses st.cache to only run once.
@st.cache(allow_output_mutation=True, hash_funcs={"_thread.RLock": lambda _: None})
def init_connection():
return mysql.connector.connect(**st.secrets["mysql"])
conn = init_connection()
# Perform query.
# Uses st.cache to only rerun when the query changes or after 10 min.
@st.cache(ttl=600)
def run_query(query):
with conn.cursor() as cur:
cur.execute(query)
return cur.fetchall()
rows = run_query("SELECT * from mytable;")
# Print results.
for row in rows:
st.write(f"{row[0]} has a :{row[1]}:")
|
看到st.cache上面了吗?如果没有它,Streamlit 将在每次应用重新运行时运行查询(例如在小部件交互上)。使用st.cache,它仅在查询更改或 10 分钟后运行(这就是ttl目的)。注意:如果您的数据库更新更频繁,您应该调整ttl或删除缓存,以便查看者始终看到最新数据。在此处阅读有关缓存的更多信息。
如果一切顺利(并且您使用了我们上面创建的示例表),您的应用程序应如下所示:

Streamlit Demo: The Udacity Self-driving Car Image Browser#
This project demonstrates the Udacity self-driving-car dataset and YOLO object detection into an interactive Streamlit app.
The complete demo is implemented in less than 300 lines of Python and illustrates all the major building blocks of Streamlit.
How to run this demo#
1
2
| pip install --upgrade streamlit opencv-python
streamlit run https://raw.githubusercontent.com/streamlit/demo-self-driving/master/streamlit_app.py
|